The Role of Derivatives in Crypto Volatility
In cryptocurrency, the tail often wags the dog. While spot markets represent actual asset ownership, the derivatives markets (futures and options) dictate the speed and severity of price action. Because traders use leverage (borrowed capital) to magnify their positions, relatively small moves in the underlying asset can trigger massive liquidations in the futures market, causing cascading volatility.
To trade professionally, you cannot rely solely on price charts. You must understand the underlying mechanics of leverage, positioning, and market sentiment. CoinGlass is the industry-standard dashboard for visualizing this data.
Core CoinGlass Analytics Tools
CoinGlass consolidates data from all major exchanges (Binance, OKX, Bybit, Coinbase, etc.) into unified, readable charts.
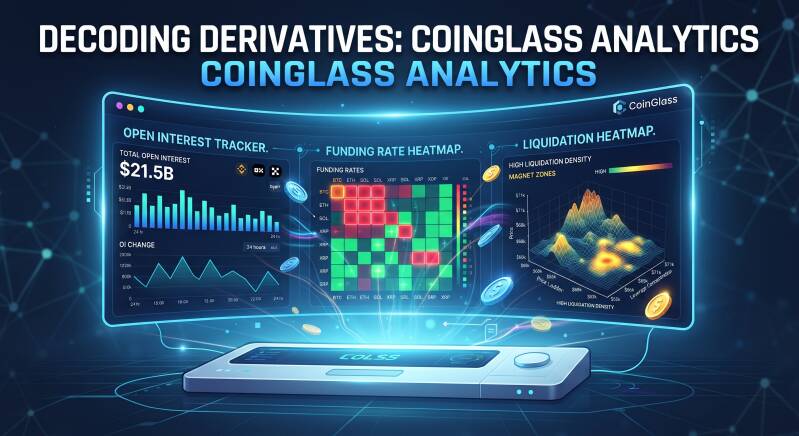
1. Tracking Futures Open Interest (OI)
Open Interest is the total value of all outstanding (unsettled) derivative contracts. It tells you how much capital is currently parked in futures positions for a specific asset.
-
Rising OI + Rising Price: Indicates new money is entering the market to support an uptrend. The move is considered "healthy."
-
Rising OI + Falling Price: Indicates aggressive short selling or traders "catching a falling knife" on longs. High risk of capitulation.
-
Falling OI + Price Movement: Indicates traders are closing positions, often referred to as "long unwinding" or "short covering." This signals a likely consolidation or weakening trend.
Use CoinGlass to compare OI across different exchanges to see where the leverage concentration lies.
2. Analyzing Funding Rate Shifts
Perpetual futures contracts do not have an expiry date. To keep the futures price tethered to the spot index price, exchanges use a mechanism called Funding Rates.
-
Positive Funding: Long traders pay short traders. This indicates the market is predominantly bullish and leveraged to the upside.
-
Negative Funding: Short traders pay long traders. This indicates the market is predominantly bearish and leveraged to the downside.
How to Use Funding Rates
Extremes in funding rates are signals of potential trend reversals.
-
Dangerously High Positive Funding: When everyone is long and paying high fees to stay in, the market is overheated. This is a prime setup for a "long squeeze," where a sudden drop forces leveraged longs to sell, accelerating the decline.
-
Deeply Negative Funding: When everyone is positioned for a crash, the market is often oversaturated with shorts. This sets up a "short squeeze," where positive news causes shorts to cover (buy back), driving prices up violently.
CoinGlass provides a heatmap of funding rates across assets, allowing you to spot assets with extreme positioning.
3. The Crypto Liquidation Heatmap
This is perhaps the most powerful visual tool on CoinGlass. A Crypto Liquidation Heatmap shows you where significant leverage is clustered on the order books.
Traders place stop-loss orders or hold liquidation prices near specific technical levels (e.g., just below round numbers like $50k or just above previous swing highs). The heatmap visualizes the total dollar value of liquidations that will trigger if the price hits those levels.
-
How to Read It: The brighter the color (often yellow or red) at a specific price point, the higher the "liquidity" residing there.
-
The Magnet Effect: Price is often drawn toward areas of high liquidation density. Market makers and large entities can see these heatmaps and may push the price toward these clusters to trigger the cascade, enabling them to accumulate assets at better prices.
By looking at the heatmap, you can identify "pain points" above and below current market price where volatility is most likely to erupt.
Conclusion: Developing a Sentiment-Aware Strategy
Relying solely on moving averages or RSI in crypto is incomplete because these indicators derive from price itself. CoinGlass allows you to analyze the cause of the price movement: leverage and positioning.
By monitoring futures open interest for trend confirmation, reading funding rate shifts for sentiment extremes, and studying liquidation heatmaps to anticipate volatility pockets, you gain a significant edge over traders looking only at raw price charts.
Integrate these derivatives metrics into your analysis to confirm setups and avoid entering positions when the market leverage is dangerously skewed.
Add comment
Comments